Reporting agents
Reporting turns performance into repeatable, shareable reports and dashboards. The product describes the family as: “reopen recurring reports, save the metrics your team checks often, and share clear performance updates without rebuilding the same view each time.”
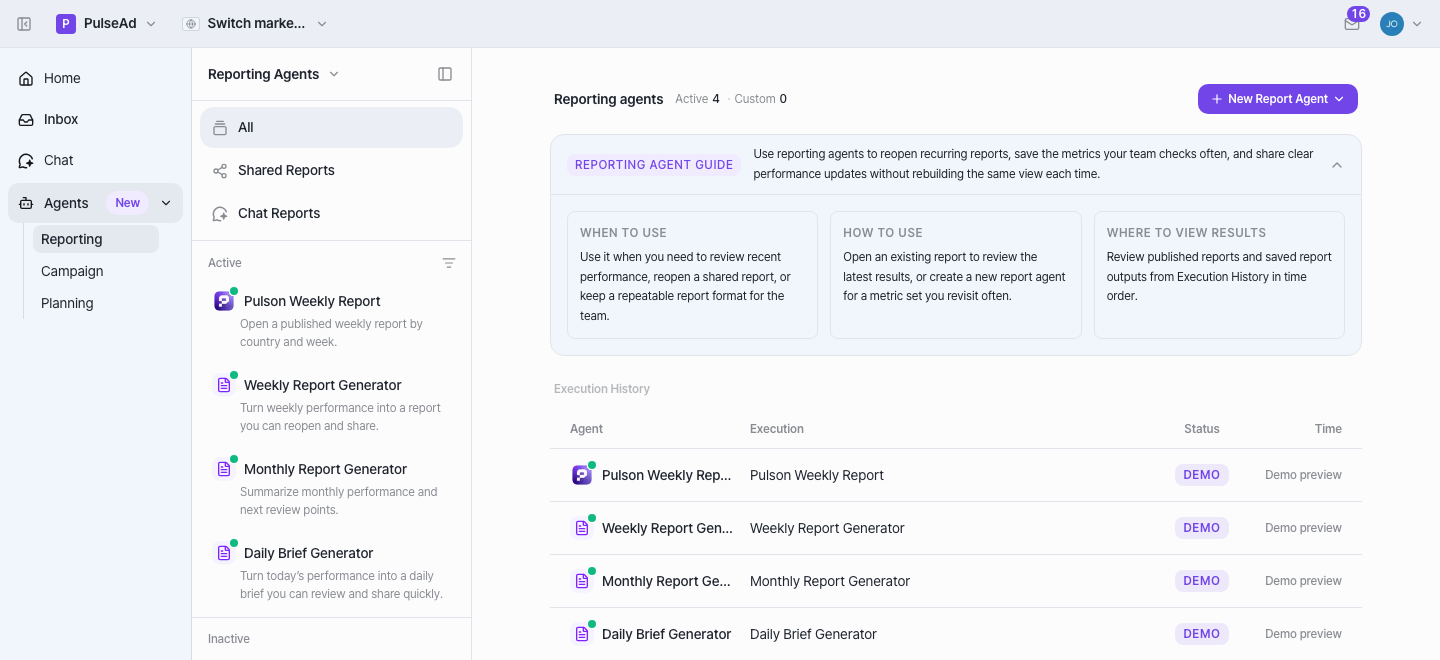
There are three kinds here: one managed report published by Pulson operators, three self-serve generators you run on demand, and two always-available dashboard agents (Overview Dashboard, Event Monitoring — added 2026-06-22/24, not pictured in the screenshot above, which predates them). The page also has Shared Reports and Chat Reports tabs (team-shared reports, and reports produced from a chat turn).
Common ground
Section titled “Common ground”All six read from Snowflake, scoped to your profile/country — primarily
DAILY_OVERALL_PERFORMANCE and DAILY_TOTAL_ADS_CREATIVE_REPORT (with vendor
sales data where applicable). All are read-only — any action cards in the
output (e.g. “cut this bid”) are suggestions, not applied changes.
The agents
Section titled “The agents”Pulson Weekly Report (managed)
Section titled “Pulson Weekly Report (managed)”- What it does: View a managed-service weekly report by selecting a country and week. There’s no on-demand generation — it’s published by Pulson operators.
- Powered by:
ai-api’sweekly-reportsAPI (weekly_report.py/weekly_report_repository.py) — a plain read/serve endpoint, no agent call in the read path. This changed 2026-06-25: the previous “Powered by” here was an autonomous 4-agent LLM pipeline inpulsead-agents(data_preparer ∥ context_builder → report_writer → publisher); that pipeline was deleted (plan 091 Phase 1, “legacy Aurora weekly report system removal”) and is unrelated to what still backs this agent. What you view is ops-curated content authored through a separatepulsead-agentsadmin panel (plans 089/090, unaffected by the removal) — whether that authoring step still uses an LLM is not resolved from code; flagged in_internal/needs-johnny.md. - Default: active, managed tier.
Weekly Report Generator (self-serve)
Section titled “Weekly Report Generator (self-serve)”- What it does: Generate an on-demand 7-day report — KPI band, week-over-week comparison, spend/sales by category, core actions, and a next-week outlook (six sections).
- Powered by: the Dashboard Report Agent in
ai-api(template kindWEEKLY_REPORT_GENERATOR). - Default: active; its template is created on first use.
Monthly Report Generator (self-serve)
Section titled “Monthly Report Generator (self-serve)”- What it does: A full-month summary — KPI vs target and month-over-month, division breakdown, top product movers, category market-share change, and open items (seven sections).
- Powered by: Dashboard Report Agent (
MONTHLY_REPORT_GENERATOR). - Default: active.
Daily Brief Generator (self-serve)
Section titled “Daily Brief Generator (self-serve)”- What it does: A day-over-day snapshot — yesterday vs the 7-day rolling average, a daily KPI band, channel/product-group health and movers, cause analysis, and today’s actions.
- Powered by: Dashboard Report Agent (
BSS_DAILY_BRIEF_GENERATOR). Note: despite “daily,” it’s run on demand, not on a cron. - Default: active.
Overview Dashboard
Section titled “Overview Dashboard”- What it does: Review campaign performance as KPIs, trends, purchase and product deltas, and a status table — the always-on landing view for the Reporting tab.
- Powered by: the Dynamic Dashboard engine in
ai-api(dynamic_dashboard.py/dynamic_dashboard_service.py/dynamic_dashboard_query_plan.py) — a distinct system from the Dashboard Report Agent that powers the three generators above. - Default: active. New 2026-06-22 (shipped as the Dynamic Dashboard agent MVP on 2026-06-19).
Event Monitoring
Section titled “Event Monitoring”- What it does: Monitor Amazon events by country — hourly performance, peak windows, previous-event and normal-baseline comparisons.
- Powered by: the same Dynamic Dashboard engine as Overview Dashboard, scoped to event windows rather than the standing KPI view.
- Default: active. New 2026-06-24.
What they do not do
Section titled “What they do not do”- They do not change campaigns. Reporting is read-only. The only write is saving or scheduling a report template — which touches Pulson’s own database, never Amazon (and is one of the few actions a viewer-role user can take, see Capabilities).
- They are not free-form documents. Output is assembled from a fixed set of blocks (KPI bands, insight cards, charts, tables), so the shape is predictable.
- They do not span scopes. One report covers one team + country.
How a generator run works, end to end
Section titled “How a generator run works, end to end”The three generators run on the Dashboard Report Agent, a deterministic 3-phase pipeline (ReAct was abandoned because the LLM wrote prose instead of calling render tools):
- Fetch data — a read-only step pulls the period’s metrics from the three Snowflake views, with hard caps and mandatory tenant/country scoping.
- Plan — a structured-output step decides which directives to emit (KPI bands, cards, charts, tables, conclusions) and writes their content. It cannot emit free markdown.
- Render — a deterministic step serializes the directives to the report.
The result is saved to Execution History to reopen, re-run for a new period, or
share. The Pulson Weekly Report doesn’t run this pipeline at all — it reads
already-published content via ai-api’s weekly-reports API (see above).
Overview Dashboard and Event Monitoring don’t run it either — they’re
live queries through the separate Dynamic Dashboard engine, not saved-and-reopened
report runs.